In this blog, we learn what a digital analytics project is, how it enhances your website performance, and much more! According to a study, 40% of companies are planning to increase data-driven digital marketing budgets and 64% of marketing experts feel that data-driven policies are a must.
Digital marketing analytics is basically organizing and analyzing data so that brand performance is enhanced and we achieve a high return on investment (ROI) from our marketing efforts. This process begins with generating or applying a digital code or tags on the website, digital marketing campaign, and channels. These codes gather information such as click rate, bounce rate, open rate, engagement rate, time dwell, etc. Marketing analytics read this data and generate reports. This helps brands in making a smart decision. More companies prefer data-driven decision-making because it increases their productivity rate to 63%.
Digital analytics projects are related to digital marketing analytics but they are not completely the same. Let’s learn more about digital analytics projects!
What is a digital analytics project?
Digital analytics projects have a broader scope than digital analytics. It also includes analysis of digital data from various sources such as websites, mobile app feedback, etc. It includes using data analytics software and tools to predict customer behavior, preferences, and interests.
It includes projects such as data visualization, predictive analysis, social media data, determining customer journeys, and website analytics.
Digital marketing analytics is a product of digital analytics whereas digital analytics project includes digital marketing analytics as part of it. The only difference is in the scope of the analysis.
Digital analytics projects improve the performance of digital products, services, and channels. It focuses on social media optimization, website optimization, customer journey, email marketing, A/B testing, predictive analysis, and enhancing user experience. It gathers data from various sources such as mobile apps, websites, etc. It interprets data to predict future trends and user behavior. It also tracks the success of your strategies.
How Digital Analytics Improves Website Performance
By using digital analytics, organizations can improve customer engagement, and user experience, boost conversions and sales, enhance search engine ranking, focus on qualified leads, help in improving the quality of leads, increase sales, and improve marketing campaigns. Other than these benefits, there are many ways in which digital analytics improve website performance
- Bottleneck: It helps analyze user behavior so that businesses identify the areas that cause drop-offs or increases.
- A/B Test: Data helps in creating multiple strategies so that brands can understand which design strategy suits them.
- Optimize user experience: It improves navigation, content, and design to enhance engagement of the business.
- SEO: It helps in creating strategies that enhance SEO and increase the organic traffic of the website.
- Content strategy: Analyze content and elements of content such as headlines, topics, format, etc to enhance user engagement.
- Mobile performance: It enhances the user’s mobile experience.
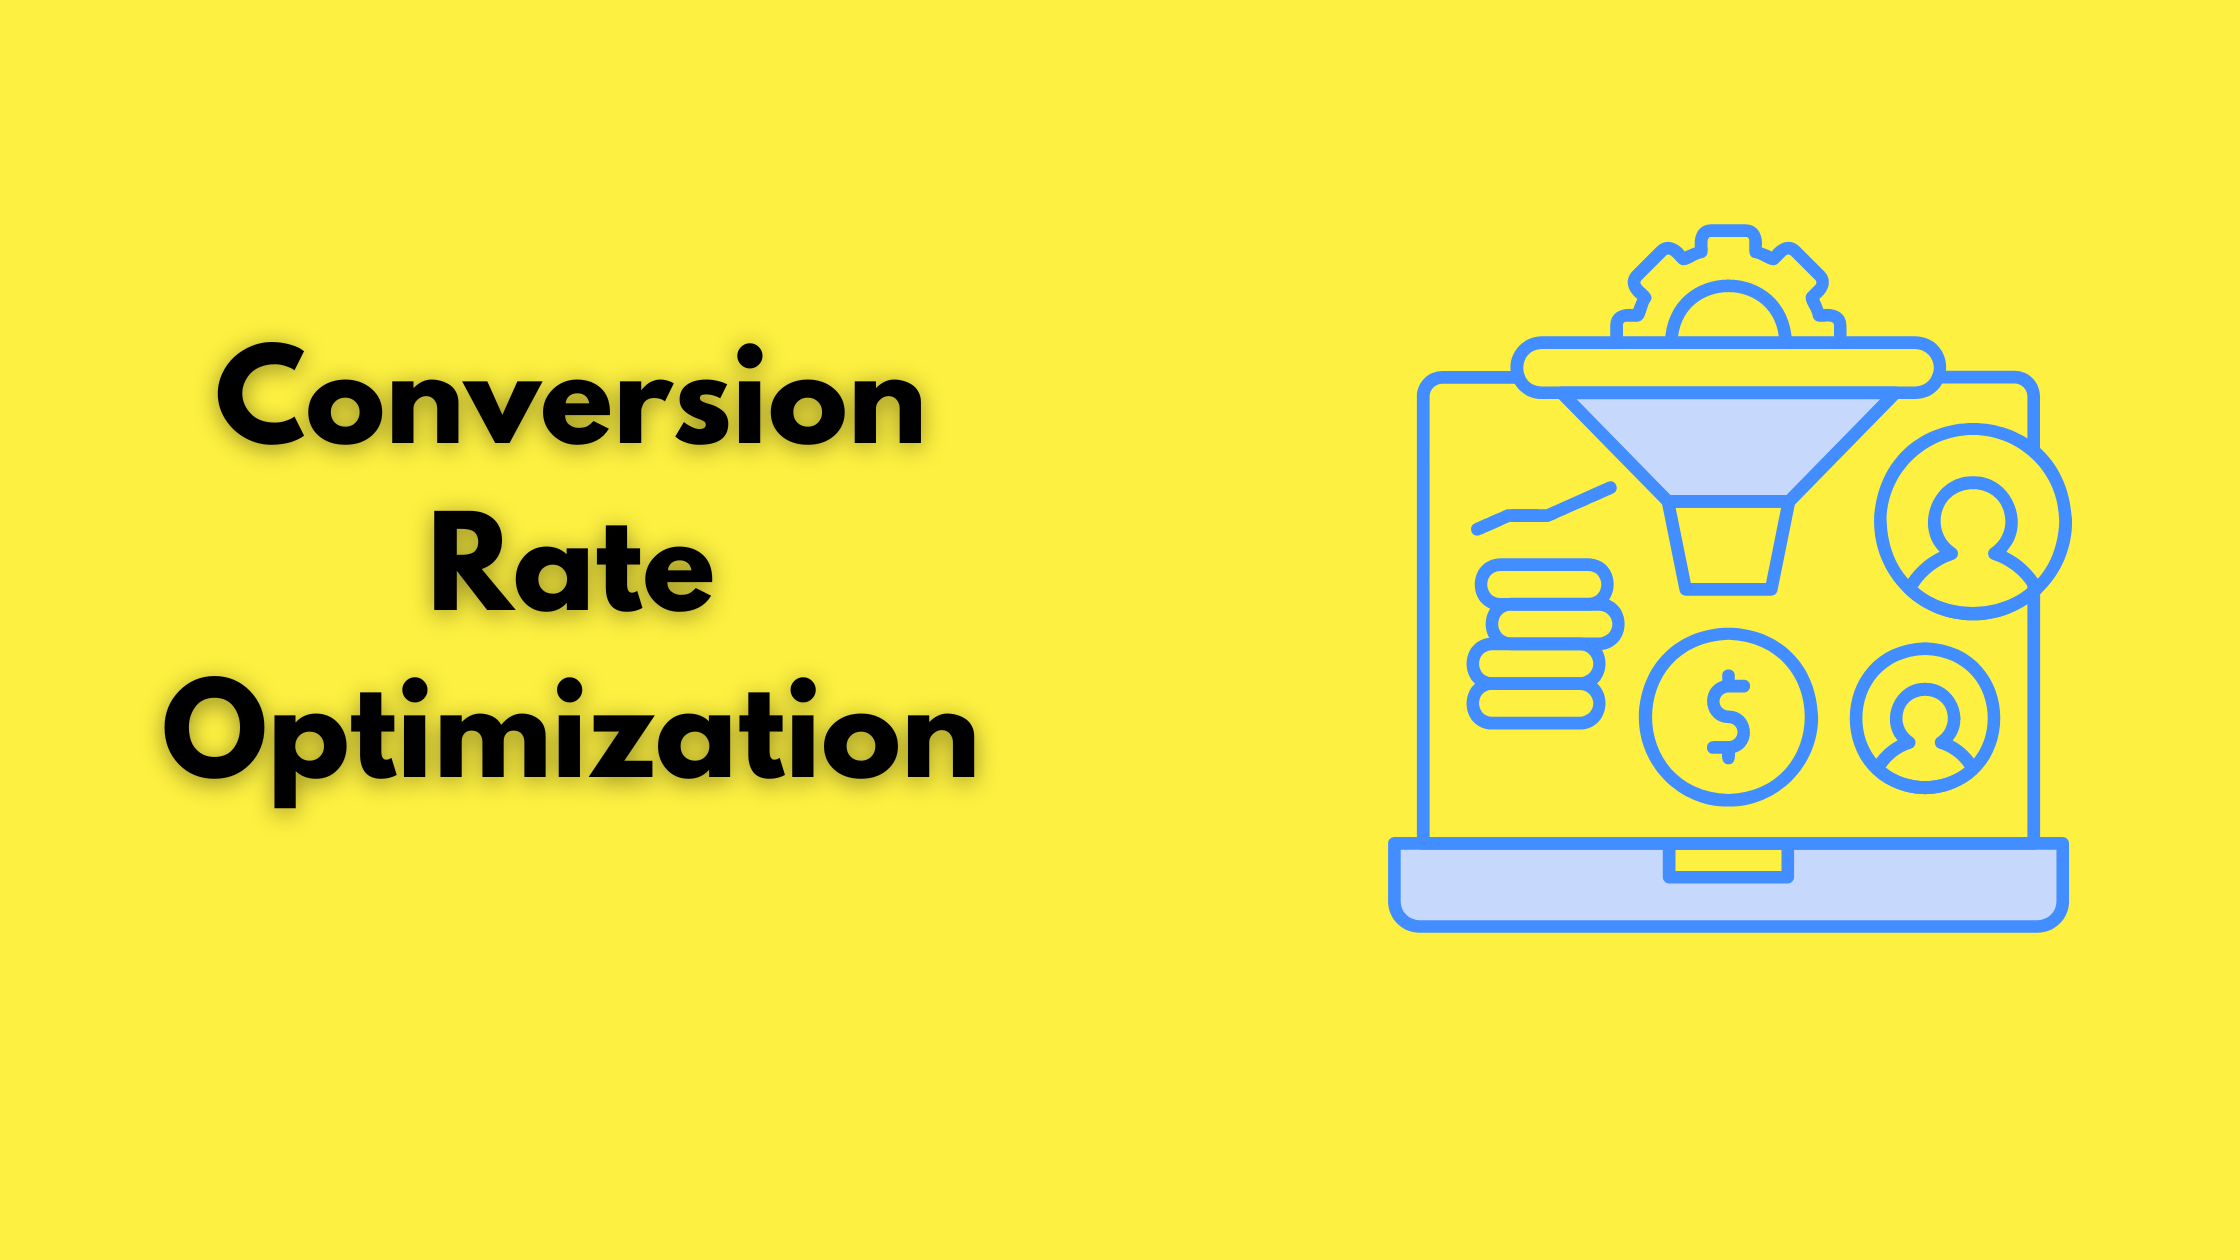
- Conversion: It helps in creating optimized steps so that the desired action is fulfilled.
- Personalized experience: It helps in creating a personalized experience for the users. It helps create content for users according to the data available that is related to them.
- Site speed: It helps in pinpointing the technical glitch that impacts the speed and user experience.
- ROI: The data helps in evaluating the result of your marketing strategy for business growth and increasing sales.
Digital analytics project for enhancing website
Here is a digital analytics project plan for increasing website conversion rate, engagement, and user experience.
Goal: Increase conversion rate, and engagement rate and enhance user experience
Objective: Boost conversion by 25%, reduce bounce rate by 19%, and increase average session duration by 29%.
Methodology
- Collecting data: You can collect data from Google Analytics and set up event tracking for form submissions, clicks, etc. Also, you can use feedback tools as well.
- Data analysis: Analyze the data of websites such as traffic and engagement. Track conversion funnel. Also analyze the data of user behavior, interests, and preferences.
- Insight: In this stage find the areas of improvement such as content, CTA, etc, and user interests and characteristics.
- Recommendation: Conduct A/B testing for elements such as CTA, content, headlines, etc. Enhance content strategy and mobile performance. Focus on website navigation and structure.
- Execution: Different teams should work together in sync with each other. Create and publish content and conduct a/b testing.
- Monitoring: Track metrics such as conversion and bounce rate. Analyze the result of the test. Also, rework the content strategy to boost engagement.
- Results: Monitor the results and make necessary accommodations. Also, remember it’s an ongoing process.
Tools & technologies
- Google Analytics
- Google Optimize: A/B testing
- Review Management Software: Lumia 360, do you know People spend 50% more on businesses that respond to reviews regularly.
- Heatmap: Mouseflow etc
- Seo Audit: SEMrush etc
Utility
- Website Report & Analytical Results
- User behavior report & feedback
- A/B testing
- The website’s performance increased with an increase in engagement and conversion
A data analytics project is necessary to improve the performance of your website. It enhances your website’s conversion and engagement rate. It enhances user experience. It also optimizes the speed and mobile performance of your website. It improves your search engine ranking, social media performance, and marketing campaigns. Data helps in making smart decisions and predicting future trends. Businesses that keep pace with future trends are more likely to succeed in the future. To learn more about digital marketing and web design, email us at info@lumia360.com or call us at 514-668-5599.
Read Also: Social Media Marketing for a Local Business
Read Also: Beyond Ratings: Harnessing the Power of User-Generated Content for Brand Advocacy


